
Your First Concept Map
This tutorial walks you through mapping a GitHub portfolio, reviewing the generated concept graph, and tailoring the domain taxonomy to your project narrative.
We will map the repositories of GitHub user ghchinoy.
What You Will Need
- The
repotographerbinary installed on your PATH. - GitHub CLI (
gh) logged in to GitHub. - A
GEMINI_API_KEYexported in your terminal (or--llm=falsefor offline mode).
1. Run the Map Command
-
Execute the one-step mapping command
Run
repotographer maptargetingghchinoyand specify an output folder:Terminal window repotographer map ghchinoy --out ./out -
Observe the pipeline steps
The terminal shows each stage of the analysis:
🔍 Fetching public repositories for 'ghchinoy' via `gh`...✓ Retrieved 139 repositories from GitHub.🧩 Building concept graph and detecting technology hubs...✓ Concept graph initialized: 137 repos included across 9 tech hubs.✨ Proposing domain taxonomy with Gemini (gemini-3.7-flash)...✓ Gemini proposed 5 thematic domains.📄 Graph JSON: out/graph.json📝 Taxonomy Curation File: out/taxonomy.json🌐 Interactive HTML Visualizer: out/graph.html📊 Graphviz DOT: out/graph.dot🖼️ Static Graph Image: out/graph.png🎉 Success! Concept map created in ./out
2. Explore the Interactive Visualizer
You can test a live render right now in your browser before running the command locally:
When running locally, open the generated visualizer from your output directory:
open ./out/graph.htmlxdg-open ./out/graph.htmlstart ./out/graph.htmlThe interactive viewer provides several exploration controls:
- Collapsed Domain Pillars: Domains start collapsed (for example,
⊞ AI Agents, A2A & MCP Systems (14)). Dashed virtual edges connect domain boxes to external technology hubs. - Expanding Domains: Click any domain node to expand its boundary box and view its member projects.
- Standalone Sub-Buckets: Projects without external connections are grouped inside an interactive
⊕ Standalone · Nsub-bucket pill to keep the initial view clear. Click the pill to expand these projects. - Connected Only Toggle: Click the
⚡ Connected Onlychip in the top filter bar to focus purely on interconnected projects and technology hubs. - Inspector Drawer: Click any repository node to open the right-hand inspector. It displays the project description, language, detected stack tags, connectivity tier, and a direct link to the GitHub repository.
3. Review the Static Artifacts
Inside the ./out directory, repotographer generated three additional files:
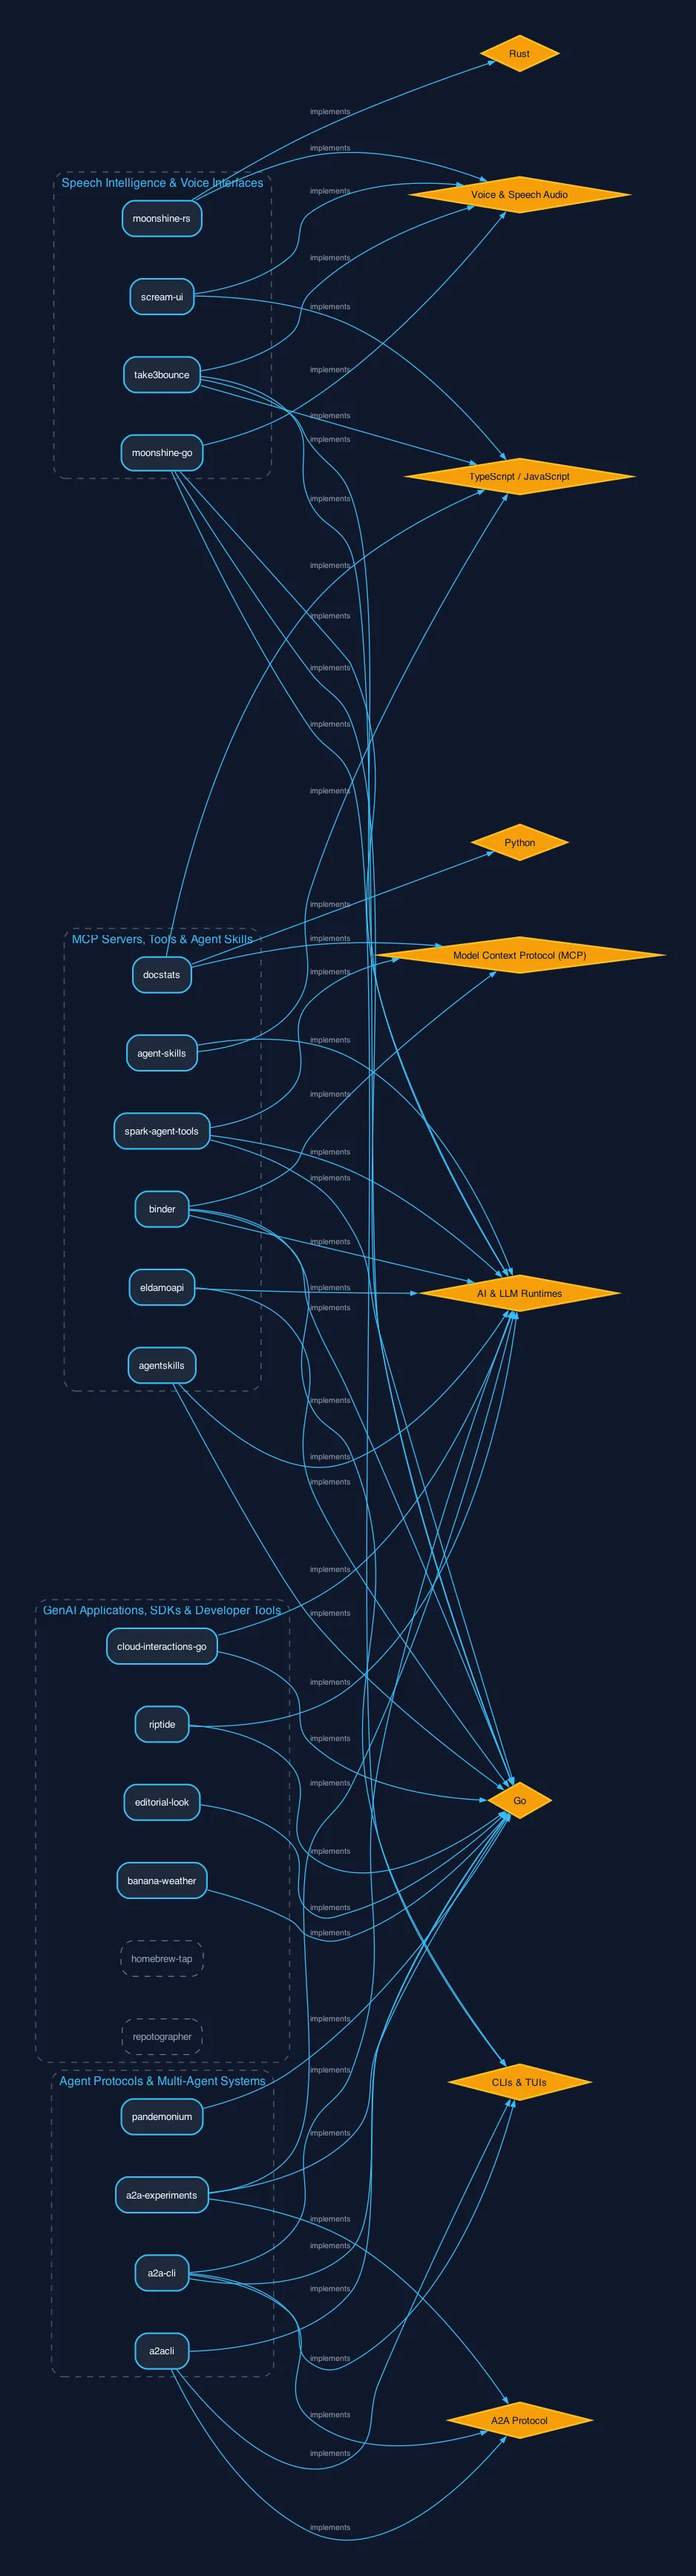
graph.png: A high-resolution Graphviz rendering suitable for READMEs and presentations.graph.dot: The raw Graphviz source script with cluster subgraphs and styled node definitions.graph.json: A portable JSON representation compatible with web components and automated documentation systems.
Here is the static graph produced for ghchinoy:
4. Customize the Domain Taxonomy
Gemini proposes a baseline taxonomy, but you retain full control over the narrative structure.
-
Open
taxonomy.jsonin your editor{"domains": [{"id": "domain_agentic_ai_protocols","label": "AI Agents, A2A & MCP Systems","blurb": "Architectures, protocols, skills, and tooling for autonomous agents."}],"assignments": {"repo_a2acli": "domain_agentic_ai_protocols"}} -
Adjust labels, blurbs, or assignments
You can rename domains, update descriptions, add new domain objects, or reassign a repository ID to a different domain.
-
Re-render your updated visual assets
Run
repotographer renderwith your edited taxonomy file:Terminal window repotographer render ./out/graph.json --taxonomy ./out/taxonomy.json --out ./outThe tool updates
graph.html,graph.dot, andgraph.pngimmediately without re-fetching from GitHub or making new LLM calls.